Climate I – The Drivers
Our weather lately has been the talk of the town. Following up on a recent Prairie Preview conversation, I will sketch out some basic aspects of our climate (I), plus a bit about climate change (II). Given the amount of ink that has already been spilled on these subjects, I don’t know what readers are already familiar with, but I’ll try to keep it relevant. Let us begin with the basic drivers of our local climate, and these are largely “permanent” in spite of human activities.
One fundamental is our geographic position on the globe, boxed in between the Appalachians and the Rocky Mountains. In February, the heating air above the Gulf of Mexico rolls north between these parallel mountain ranges, which attempt to confine it. This warm and wet slug is pushing firmly against the cooler and dryer arctic air already there and, when chilled, the moisture in the contact zone condenses to rain and releases the solar energy that was used originally to evaporate it from the Gulf, producing strong winds. The tornado season thus often begins in March in the Gulf States, and was already right on schedule this year.
As summer intensifies, the warm/cold clash drifts northward, usually peaking out in August in Iowa and the northern USA, and by September this high energy conflict zone is usually pulsing southward again.
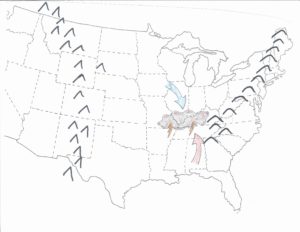
The origin of many of our mid-continental storms.
This situation is the definition of a monsoon. The extreme example, of course, is India, where a large land mass faces a fully tropical ocean, which has aggressive evaporation rates and much moisture available. There, the poleward-moving air of summer is trying to climb the Himalayas and tends to stall, which can leave a lot of rain falling in one place. The record rainfall that I know about is for a series of these stalls from August 1860 through July 1861, dropping a total of 1041 inches on Cherrapunji. This is not a typo error – yes, in excess of a thousand inches in eleven months. Play with this number a bit to be fully impressed. By comparison, 37-56 inches in a few days did serious harm to Houston in 2017 (see Record Rains). Where slopes are steep, flash floods can sweep through in hours. A foot of rain over Big Thompson canyon (Colorado) in 1976 swept the valley clean, pulverizing houses, cars, bridges and people, with 139 deaths. This is the bomb we are playing with when we tamper with the atmosphere.
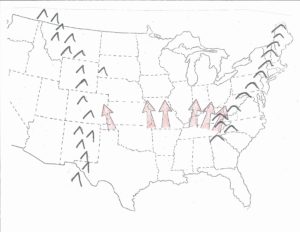
Arrows symbolize relative frequency of the tracks of Gulf Air during a year.
The other most important driver of our weather here is the Prevailing Westerlies. They prevail because they are in turn driven by the sun preferentially heating the equatorial zone, and the spin of the earth, and I don’t think these will change anytime soon. Almost all of the midcontinent precipitation is evaporation water sourced from the Gulf of Mexico (the Rockies intercept Pacific water, evaporation from the arctic is too slow to supply much, and the Atlantic is downwind). Wet air masses pumping northward from the Gulf are continuously also being nudged eastward by the Prevailing Westerlies. Consequently, eastern Colorado only averages 12 inches of precipitation per year because Gulf air so infrequently visits, due to the opposing flow of the Westerlies. Iowa averages more Gulf air accompanied by about 30 inches of precipitation per year. Ohio sees still more visitations, averaging about 40 inches.
This rainfall gradient is the basic driver for the gradient of native ecosystems spread across the midcontinent, from west to east – shortgrass prairie, midgrass prairie, tallgrass prairie, open savanna, and closed canopy forest. This gradient also drives much of the agriculture that has replaced the natives – grassland grazing, wheat and sunflowers, corn and beans.
There are other climatic forces and sources which occasionally affect our weather, especially air masses coming from other directions and carrying their own burden of temperature, pressure, moisture, dust, pollen, etc.; including the dry southwestern desert air, and the cool and moist air from the Pacific Northwest. While these can each occasionally influence a few days weather directly each year, their impact upon our overall climate is small compared to the pattern sketched on the maps.
Stay tuned, and next week I’ll try to weave the climate change story into these basics.
Reference for record rainfall: Linsley et al, 1982, Hydrology For Engineers, McGraw-Hill, table 4-7.
Tags: climate, climate change, Lon Drake